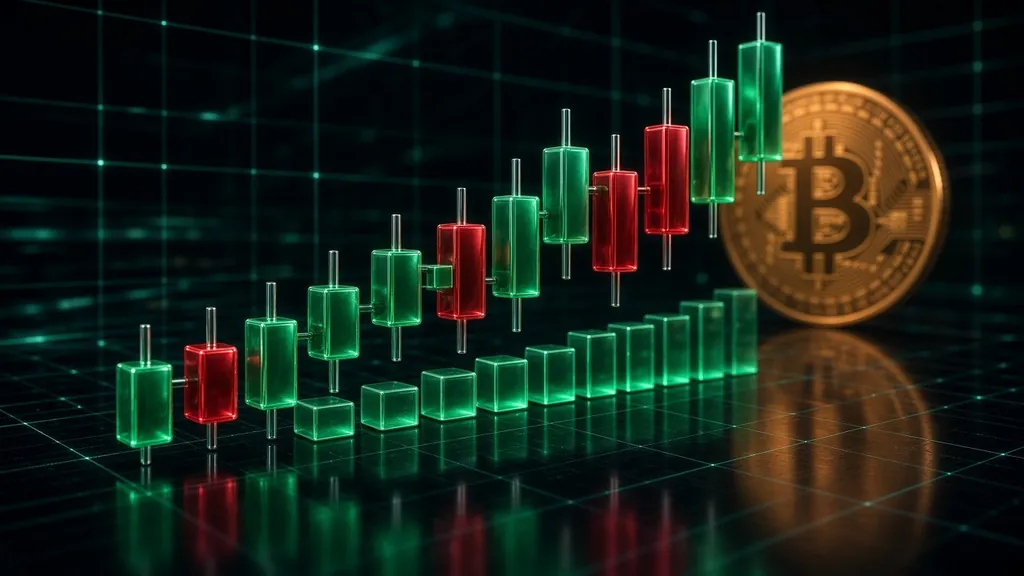
Open any crypto chart for the first time and it looks like noise. Green bars, red bars, thin lines poking out of both ends and a row of bars along the bottom. Most beginners either give up or start guessing. Neither works. A chart is just a record of what buyers and sellers already did. Once you can read that record you stop reacting to headlines and start making plans. This guide shows you how to read crypto candlestick charts step by step: what every candle means, which timeframe to start on, how to spot a trend, how to use volume and how 24/7 markets change the picture in 2026.
What a crypto chart actually shows
A price chart plots price on the vertical axis and time on the horizontal axis. Most charting platforms let you pick a line chart, a bar chart or a candlestick chart. All three use the same data. They just draw it differently.
| Chart type | What it shows | Best for |
|---|---|---|
| Line chart | Only the closing price of each period, joined by a line | Seeing the big-picture direction at a glance |
| Bar chart (OHLC) | Open, high, low and close as a vertical bar with small ticks | Traders who want the full range without color |
| Candlestick chart | Open, high, low and close as a colored body with wicks | Reading direction and buyer-seller pressure fast |
Candlesticks are the default on almost every crypto exchange and charting site. They were first used by Japanese rice traders centuries ago, as Investopedia explains. The rest of this guide uses candlesticks.
Check the basics before you read anything
Before you look at a single candle, confirm three things at the top of the chart:
- The market. BTC/USD on one exchange and a BTC perpetual futures contract on another are different markets. Prices are close but not identical.
- The quote currency. A coin priced in USD, USDT or BTC can look very different. A chart of a coin priced in BTC tells you how it is doing against bitcoin, not against the dollar.
- The timeframe. Each candle can represent one minute, one hour, one day or one week. The same market can look bullish on one and bearish on another.
Candlestick anatomy: body, wicks and color
Each candle covers one period and shows four prices:
- Open: the first traded price in the period.
- High: the highest price reached.
- Low: the lowest price reached.
- Close: the last price when the period ended.
The thick part is the body. It runs from the open to the close. The thin lines above and below are the wicks (also called shadows). The top of the upper wick is the high. The bottom of the lower wick is the low.
Color tells you which way the period went. On most platforms a green candle closed above its open and a red candle closed below its open. Some themes swap colors or use hollow and filled bodies so always check your chart settings. Charles Schwab's chart guide describes the same structure for stocks. Candles work the same way across digital assets.
A worked example
Say a daily bitcoin candle has these prices. These are round example numbers to show the math, not a real day.
- Open: $80,000
- High: $82,000
- Low: $79,000
- Close: $81,500
Here is how you read it:
- Color: green, because the close ($81,500) is above the open ($80,000).
- Body: $1,500 tall ($81,500 minus $80,000).
- Upper wick: $500 ($82,000 minus $81,500). Price pushed to $82,000 but sellers knocked it back before the close.
- Lower wick: $1,000 ($80,000 minus $79,000). Price dipped to $79,000 and buyers pulled it back up.
- Full range: $3,000 ($82,000 minus $79,000).
The story: buyers won the day and defended the dip but ran into selling near $82,000. That is useful information. It is not a forecast.
What wick and body shapes tell you
| Candle shape | What happened in the period | What it can suggest |
|---|---|---|
| Long body, short wicks | Price moved one way almost the whole time | Strong pressure in that direction |
| Small body, long wicks on both sides | Price swung up and down and closed near the open | Indecision or a tug-of-war |
| Long upper wick | Price rallied then got pushed back down | Selling showed up at higher prices |
| Long lower wick | Price dropped then got bought back up | Buying showed up at lower prices |
| Open and close almost equal (doji) | Neither side won the period | A pause. Needs the next candles to mean anything |
What a candle does not show you
A candle tells you the four prices. It does not tell you the order trades happened in. Two candles with identical open, high, low and close can come from very different paths. It also can't tell you who was trading or why. In thinner markets a single large order can print a dramatic wick that looks meaningful but is just a brief gap in liquidity. Treat candles as evidence, not proof.
Pick the right timeframe first
Timeframe is where most beginners go wrong. A 1-minute chart prints 1,440 candles a day. Most of them are noise. A daily chart prints one candle a day and shows you what the whole market agreed on.
| Timeframe | One candle equals | Who usually watches it |
|---|---|---|
| 1-minute to 15-minute | Minutes | Very active short-term traders |
| 1-hour to 4-hour | Hours | Swing traders planning trades over days |
| Daily | One day | Most traders and many investors |
| Weekly | One week | Longer-term investors looking at the big picture |
Our rule for beginners: start on the weekly to see the big picture, plan on the daily and only then look at the 4-hour to fine-tune. Higher timeframes are watched by more people so the levels on them tend to matter more. If you are still deciding whether you want to trade or hold long term, our guide to crypto investing vs trading helps you pick the timeframe that fits your life.
When does a daily candle close in crypto?
Stock markets open and close. Crypto spot markets trade 24/7. Most exchanges and charting sites close the daily crypto candle at 00:00 UTC, which is 8 PM Eastern during daylight saving time and 7 PM Eastern in winter. Some platforms let you change this setting. If two sites show slightly different daily candles for the same coin, a different close time or a different exchange is usually why.
The 24/7 world got bigger in 2026. CME Group moved its regulated cryptocurrency futures and options to 24/7 trading on May 29, 2026, according to the exchange. More than 7,200 contracts worth about $50 million traded over the first weekend alone. For years traders watched "CME gaps" on bitcoin futures charts because those contracts paused on weekends while spot kept trading. With continuous trading most of those weekend gaps go away going forward, though older charts still show them.
Read the trend before the candles
Candles mean much more once you know the trend. You find the trend with swing highs and swing lows, the peaks and troughs where price turned.
- Uptrend: higher highs and higher lows. Each peak tops the last one and each dip stops above the last dip.
- Downtrend: lower highs and lower lows.
- Range: price bounces between a roughly flat ceiling and floor.
Zoom out on the daily chart and mark the last three or four swing highs and lows. Connect them in your head (or with your charting tool's line). Within a minute you know which of the three you are looking at.
This matters because the same candle means different things in different trends. A red candle in a strong uptrend is often just a pause. A green candle in a downtrend is often just a bounce. A hammer-shaped candle with a long lower wick means more after a decline into an obvious floor than in the middle of nowhere.
Mark support and resistance zones
Support is an area where buying has stopped declines before. Resistance is an area where selling has stopped rallies before. Draw them as zones, not thin lines, and limit yourself to the two or three most obvious ones. We go deep on this in our guide to bitcoin support and resistance levels, including how broken support often flips into resistance.
If you want a printable version of the rules we use alongside charts, the free CCF Starter Kit has our risk and first-trade checklists in one place.
Use volume to confirm what price is saying
The bars along the bottom of most charts show volume, how much traded in each period. Volume tells you how much conviction sat behind a move.
- Price breaks a level on rising volume: more participants joined the move. The break is more believable.
- Price breaks a level on falling or thin volume: fewer people backed it. Breakouts like this fail more often.
- A huge volume spike with a long wick: often a flush where many stops or liquidations hit at once.
- Volume drying up in a range: the market is waiting. A bigger move often follows but the direction is unknown.
One crypto-specific warning: volume is reported per exchange. A coin's volume on a small exchange can look large or small depending on that venue alone. Compare volume on the same exchange over time rather than across platforms. And be skeptical of tiny tokens where a few accounts can move both price and volume.
Candlestick patterns worth knowing (and their limits)
You don't need to memorize 50 patterns. These cover most of what beginners see:
- Hammer: small body near the top, long lower wick, after a decline. Shows buyers rejected lower prices.
- Shooting star: small body near the bottom, long upper wick, after a rally. Shows sellers rejected higher prices.
- Doji: open and close nearly equal. Indecision.
- Bullish engulfing: a green body that fully covers the prior red body. Buyers took over that period.
- Bearish engulfing: a red body that fully covers the prior green body. Sellers took over.
- Inside bar: a candle whose whole range fits inside the prior candle's range. The market is compressing.
Every one of these fails regularly. Investopedia notes that candlestick patterns have limited predictive power mostly confined to the short term and work best alongside other tools. A pattern only becomes a plan when you add three things: where it appears (at a level, in a trend), confirmation (the next candle follows through) and invalidation (the price that proves you wrong).
A candle is a clue. Your plan around the clue is the trade.
Add indicators last (one or two at most)
Indicators are math run on price and volume. They can confirm what the chart already shows but they should never replace reading it. Once price, trend and volume make sense to you, add at most one trend tool and one momentum tool.
| Goal | Common tool | What it helps you see |
|---|---|---|
| Trend filter | 50-day or 200-day moving average | Whether price is holding above or below its longer-term average |
| Momentum | RSI (Relative Strength Index) | Whether a move is stretching or fading |
| Volatility | Bollinger Bands | Whether price is compressing before a bigger move |
If an indicator disagrees with clear price structure, trust the structure and treat the indicator as a reason to slow down.
A 7-step routine to read any crypto chart
Use this same routine every time. It takes about 10 minutes once it becomes habit.
- Confirm the market, quote currency and exchange. Make sure you are looking at what you think you are looking at.
- Start on the weekly. Is the big picture up, down or sideways?
- Move to the daily and mark the trend. Label the last few swing highs and lows.
- Draw two or three support and resistance zones. Only the obvious ones.
- Read the last 5 to 10 candles as a story. Are bodies getting bigger or smaller? Are wicks rejecting a level?
- Check volume. Does it support the latest move or question it?
- Write one sentence and one invalidation. For example: "Price is in an uptrend and holding the support zone. If the daily candle closes below the zone my read is wrong."
That last step is the one most people skip. It is also the one that protects your account. Once you know where you are wrong you can size the trade from that distance using the rules in our crypto risk management guide.
Chart-reading checklist
- Right market, right exchange, right quote currency
- Weekly trend noted
- Daily swing highs and lows marked
- Two or three zones drawn
- Last 5 to 10 candles read in order
- Volume checked on the same exchange
- One-sentence read written down
- Invalidation price set before any trade
- Position size calculated from the invalidation
Common chart-reading mistakes
- Reading an unfinished candle as final. The current candle keeps changing until its period ends. A "huge green candle" at noon can be a red candle by the close.
- Living on the 1-minute chart. Fast charts create fast emotions. Start slow.
- Too many indicators. Five indicators on one chart usually disagree. Learn price and volume first, then add one or two tools at most.
- Drawing lines everywhere. If every price is a level, nothing is.
- Trading the pattern without the plan. A hammer is not a buy signal. A hammer plus a level plus confirmation plus a stop is a plan.
- Ignoring costs. Frequent short-term trading adds fees, spreads and slippage. FINRA warns that frequent intraday trading can lead to losing some or all of your money and that costs add up fast.
Reading charts on tokenized stocks and other digital assets
The same chart skills work on any digital asset, including tokenized stocks, which are blockchain tokens that track a company's shares. There is one big difference. A tokenized stock can trade around the clock while the underlying stock exchange is closed. That means the token's chart can show moves on nights and weekends that the regular stock chart won't show until the next session opens, and liquidity in those off hours can be thin. Always check which market you are charting and how closely the token has tracked the real share. Our article on why Microsoft, Alphabet and other companies objected to tokenized versions of their shares explains more of the risks to check first.
How AI can help you read charts (without deciding for you)
AI tools are useful for learning to read charts. You can upload a chart screenshot and ask an assistant to describe the trend, label the swing highs and lows or explain what a candle pattern is. Use it like a study partner. Ask it to argue the opposite case. Ask it what would invalidate the read. Never let it place trades or decide for you, and never paste in exchange keys or wallet details. Our guide on how to use AI for crypto trading has copy-paste prompts for exactly this.
Frequently asked questions
How do you read crypto candlestick charts as a beginner?
Start with a candlestick chart on the daily timeframe. Read each candle's open, high, low and close, then zoom out to see whether price is making higher highs and higher lows or lower ones. Mark two or three support and resistance zones, check volume and decide what would prove your read wrong before you act.
What do green and red candles mean in crypto?
On most platforms a green candle closed higher than it opened and a red candle closed lower than it opened. Color only shows the direction of one period. Some chart themes reverse the colors so check your settings.
What do the wicks on a candle mean?
Wicks show the highest and lowest prices reached in the period. A long upper wick means price traded higher but sellers pushed it back down before the close. A long lower wick means price traded lower but buyers pushed it back up.
What is the best timeframe for crypto charts for beginners?
The daily chart is the best starting point for most beginners, with the weekly for the big picture and the 4-hour for fine-tuning. Short timeframes like 1-minute or 5-minute charts are mostly noise and push people into overtrading.
What time does the daily crypto candle close?
Most exchanges and charting sites close the daily crypto candle at 00:00 UTC. That is 8 PM Eastern during daylight saving time and 7 PM Eastern in winter. Some platforms let you change the setting.
Does volume matter on crypto charts?
Yes. Volume shows how much traded behind a move. A breakout on rising volume is more believable than one on thin volume. Compare volume on the same exchange over time because each exchange reports its own numbers.
Can candlestick patterns predict crypto prices?
No pattern predicts price reliably. Patterns describe what buyers and sellers did and work best at key levels, inside a clear trend and with confirmation from the next candles. Always set an invalidation price and size your position from it.
Can I use AI to read crypto charts?
AI can describe a chart, label trends and explain patterns, which makes it a good study partner. It can also be wrong and it doesn't know your risk limits. Use it to check your thinking, not to make the decision for you.
The bottom line
Reading crypto charts is a skill, not a talent. Learn the four prices in every candle, start on the daily, read the trend before the candles, confirm with volume and always know where you are wrong. Do that routine every time and charts stop being noise and start being a plan.
This article is general education, not financial advice. Charts describe past price action and never guarantee future results.
Free Starter Kit
Want more like this?
Get the free CCF Digital Asset Starter Kit. Security and first-buy checklists, CCF risk rules, scam red flags and a 25-term glossary in one 13-page PDF.
Education only, not financial advice. We never share your details.
Prefer to talk? Book a call
Written by

CCF · Co-founder
Teaches trading and investing built on risk management and independent decisions, and explores how AI can sharpen them. He believes in the power of 1%: small, consistent effort every day is all it takes to become the person you want to be.

CCF · Co-founder
Got into crypto in 2017. Helps people learn investing and trading through structured, practical education, so they can make their own decisions with confidence.
Educational content only. This article is general education about digital assets, trading and investing. It is not individualized financial, investment, legal or tax advice, and it is not a recommendation to buy or sell any asset. Crypto markets are volatile and involve risk, including loss of principal; leveraged products can lose more than the amount committed. CCF does not guarantee any outcome or return. Do your own research and consider speaking with a licensed professional about your situation.